

TL;DR: A view is a saved filter, not a copy. Six departments get six dashboards off one project list, and nobody duplicates a single row to get there.
Six departments need six different answers out of the same project data, and the obvious move — give each department its own copy — is the one that destroys the data. A view gives each department its own dashboard off one list, with one row per job, and the row stays single no matter how many lenses point at it.
This build assumes you already have the project list. If you do not, that is Construction Project Tracking in Microsoft Lists — one row per job, eight status values, and the money columns that make the rest of this worth doing.
Why Everyone Ends Up With Their Own Copy
It happens for a reasonable reason. Estimating does not want to scroll past forty jobs in operations to find the three they are bidding. So somebody filters, exports, and saves their own file. Now it is Tuesday’s data with Thursday’s decisions being made on it.
Within a quarter there are four copies, each a different age, and the company has quietly stopped having a single answer to “how many jobs are we bidding?” Nobody decided that. It is the accumulated result of four people each solving a real problem in the only way the tooling suggested.
The fix is to make the filtered view the thing people open — not a copy, not an export, but a saved lens on the live list. The data stays in one place and the convenience goes to the department.
What a View Actually Is
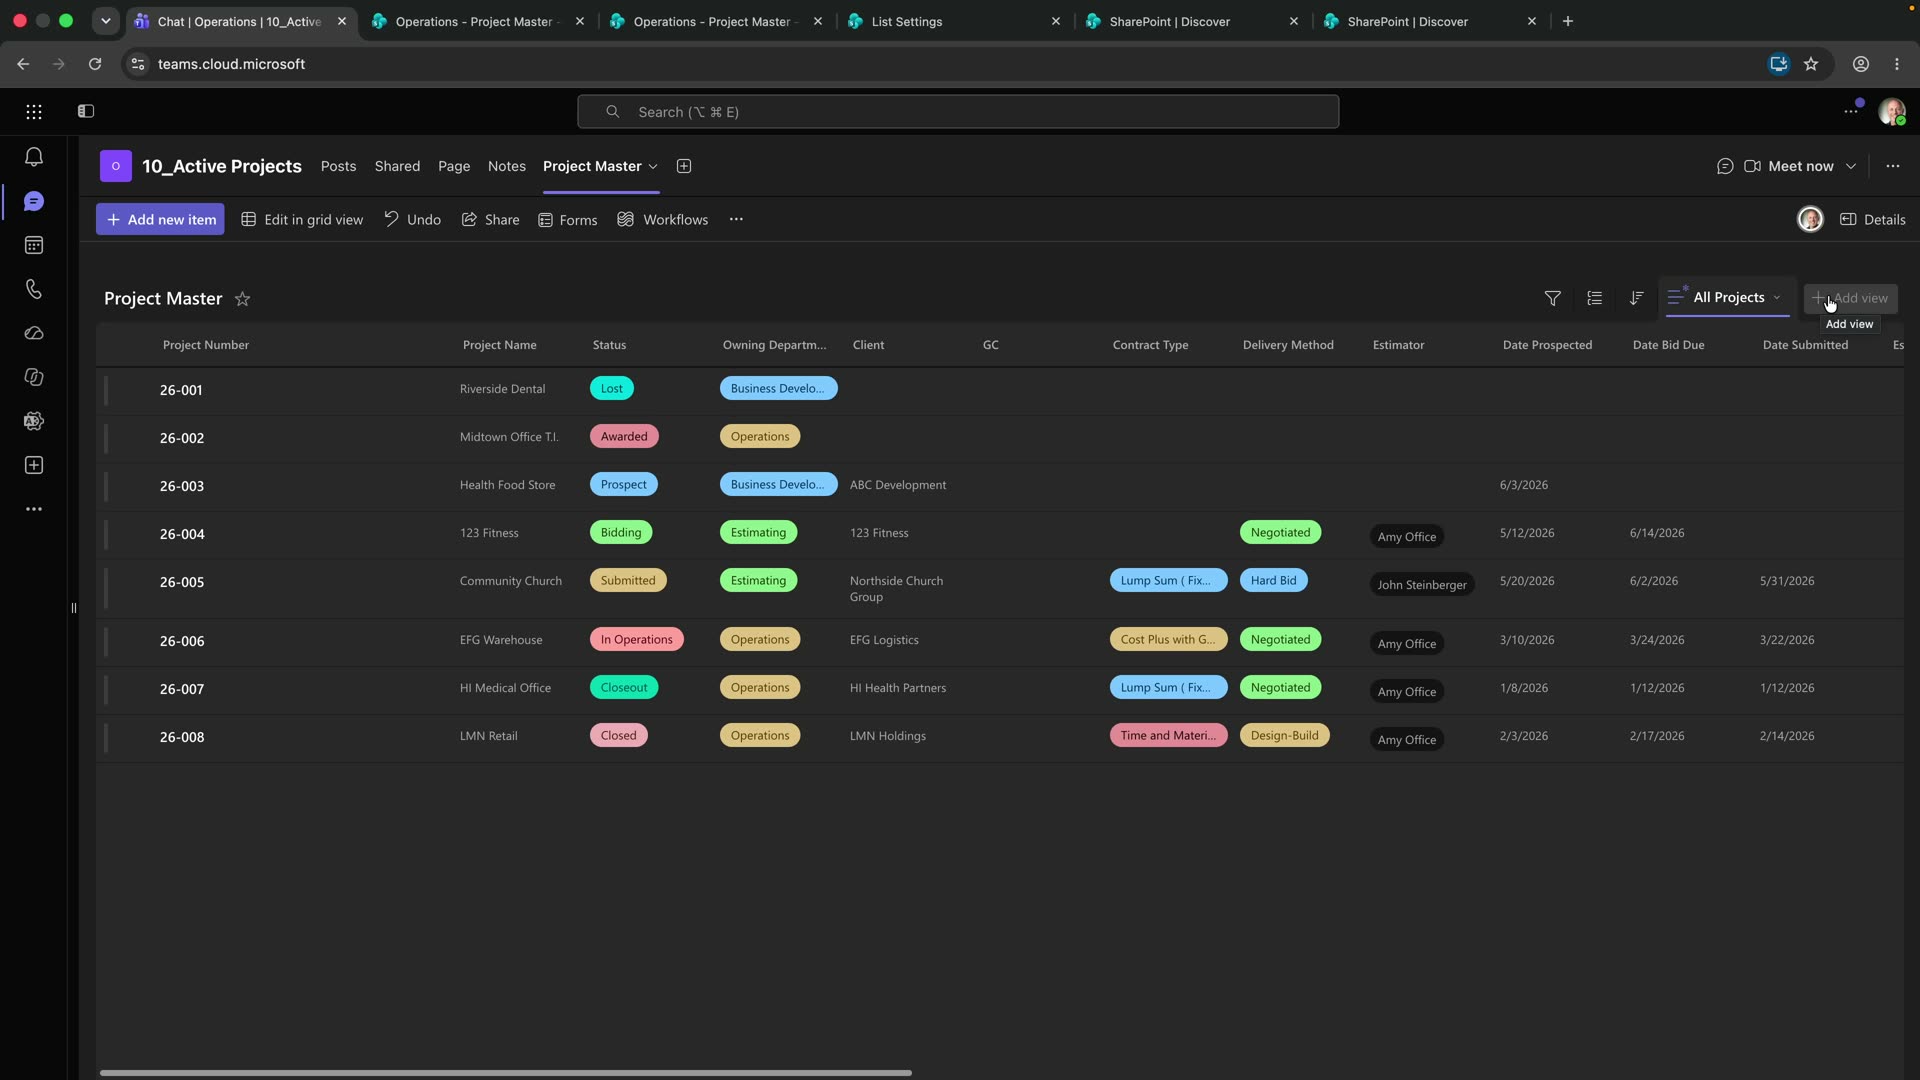
A view is a saved set of filters, sorts, groupings and visible columns. You set the list up the way you want to see it using the column headers, then save that arrangement under a name, and from then on it is one click. Microsoft documents the controls in create or change the view of a list, and grouping — which does most of the work in a dashboard view — in use grouping to modify a list or library view.
Two decisions matter when you save one. Public or private: a private view is yours alone, which is right for a working filter and wrong for a department dashboard. And which columns are hidden: hiding a column in a view does not remove the data, it removes the distraction, and a dashboard that shows every column is not a dashboard.
Every view below is a filter on Status, which is why Status was worth getting right before any of this existed.
Business Development Sees What Is Coming
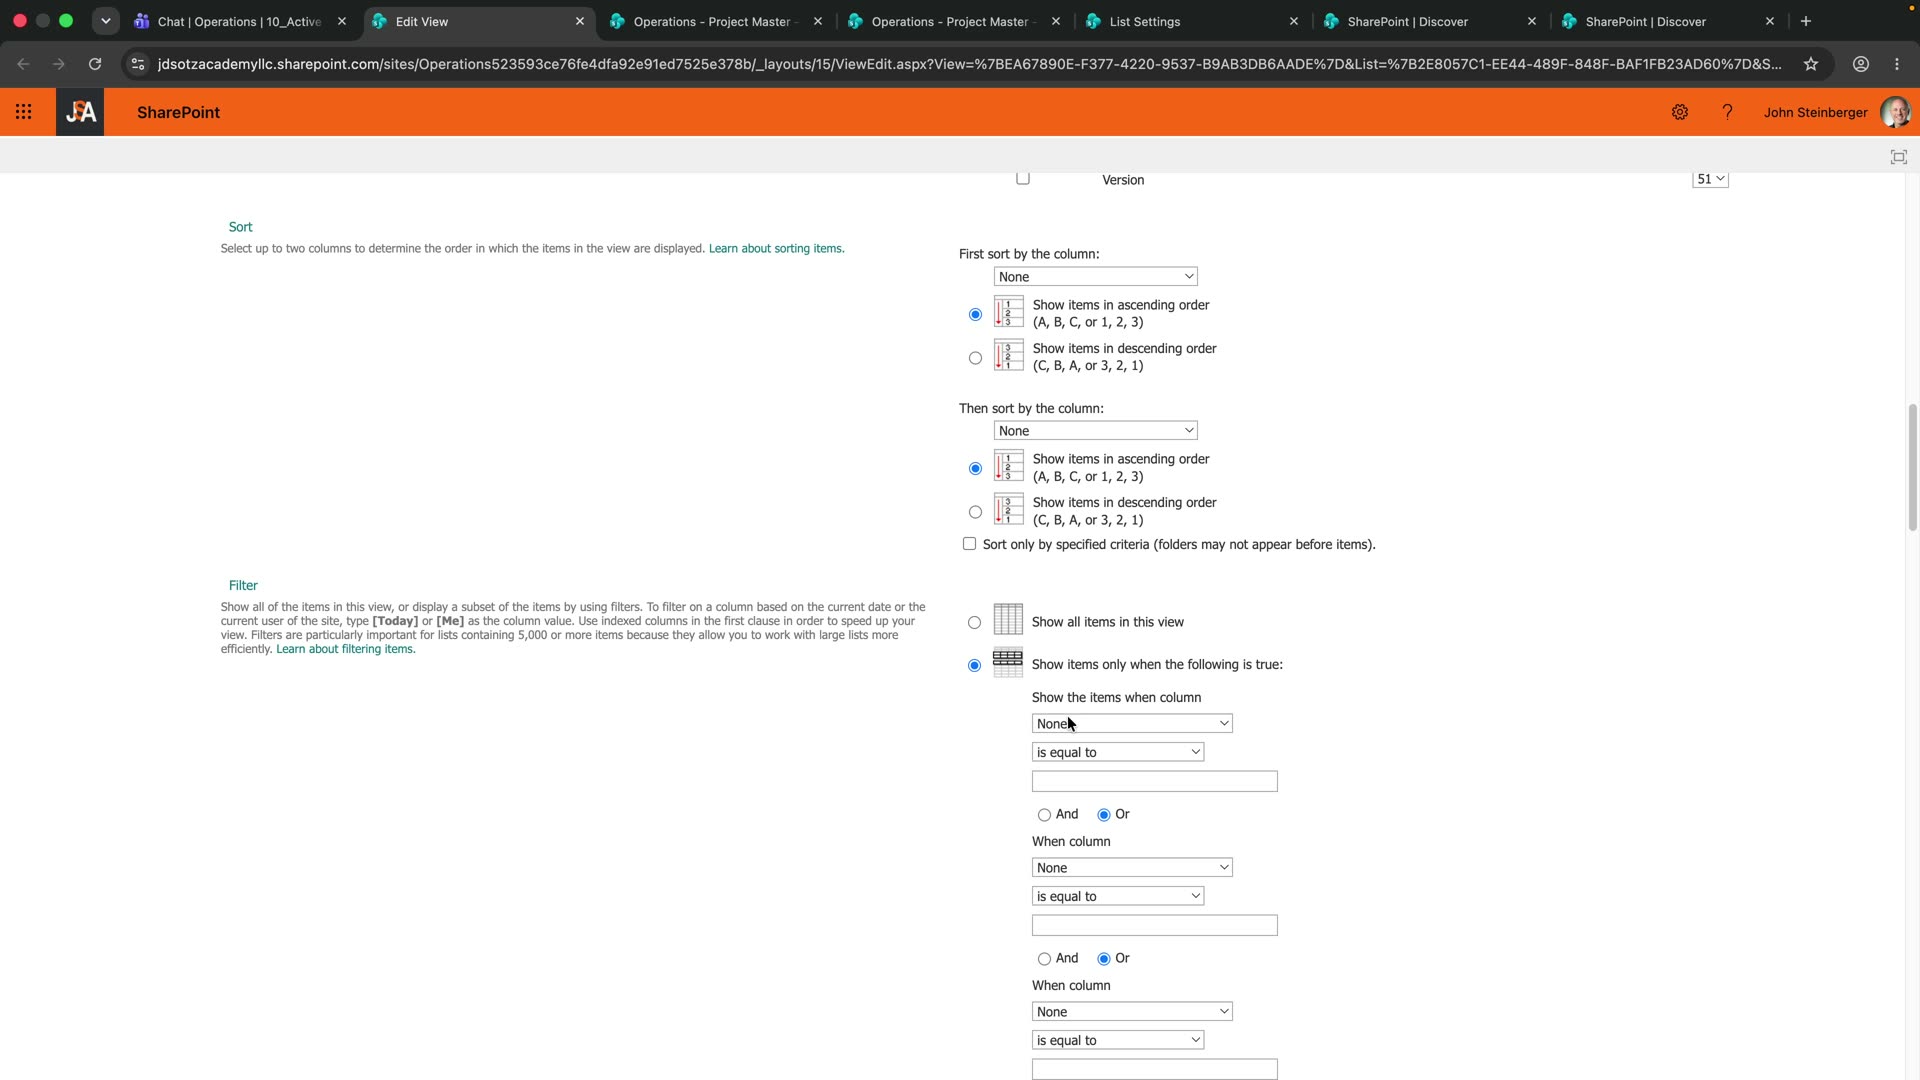
Filter to Status = Prospect and Bidding. Sort by bid due date, soonest first. Hide the actual-cost and actual-margin columns entirely — nothing has happened yet, and empty money columns read as missing data rather than as “not yet”.
Group by delivery method if your mix is varied enough for that to be a question worth asking. If it is not, do not group; grouping one row under a header is one row with a header on it.
Estimating Sees Their Own Bids
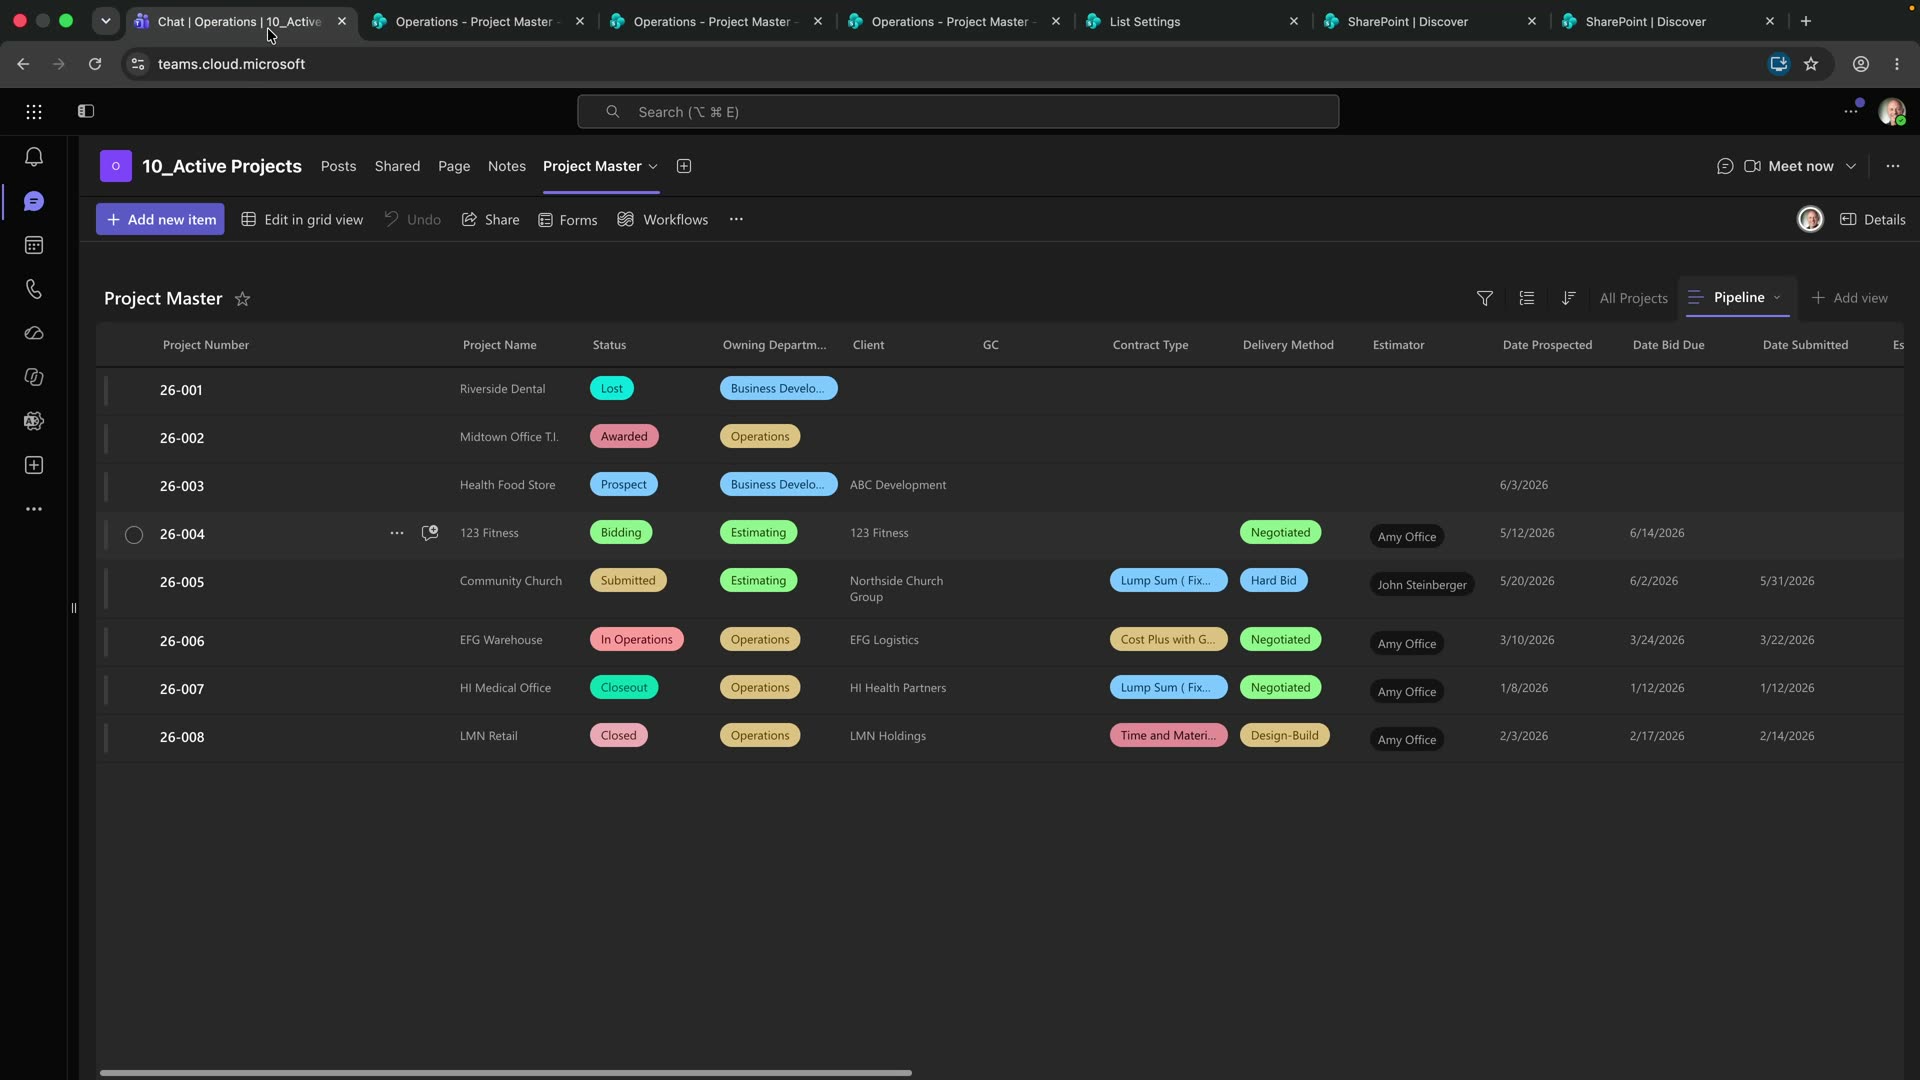
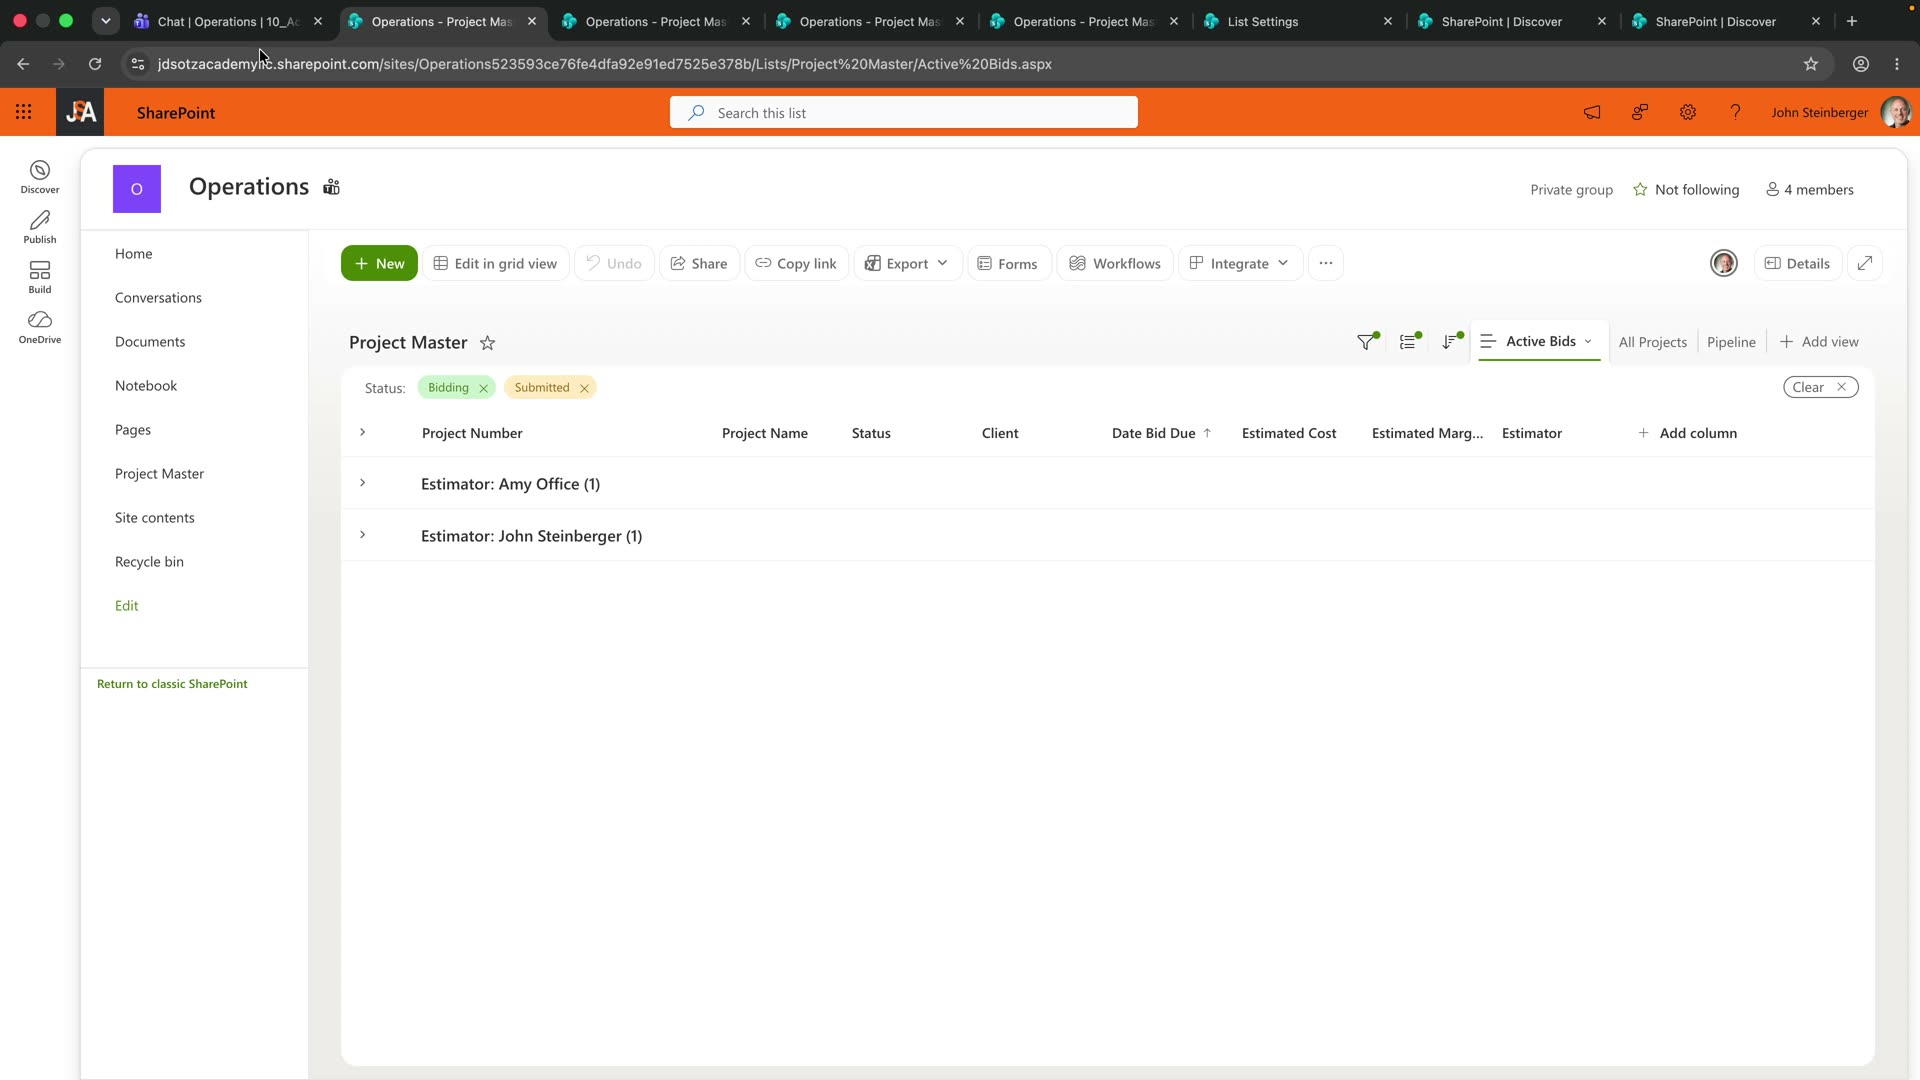
Filter to Submitted. Show estimated contract value and estimated margin, and sort by the date submitted. This is the shortest view in the build and the one most likely to get opened daily, because it answers exactly one question: what is out and waiting?
Keep it to one question. The temptation is to add awarded jobs so estimating can see what landed, and the moment you do, the view stops answering the question it was named after.
Operations Sees What Is on the Ground
Filter to Awarded, In Operations and Closeout. Group by project manager, which turns the view into a workload picture rather than a list — you can see at a glance who is carrying five jobs and who is carrying one.
Show the schedule dates and hide the bid-time fields. Operations does not need the bid due date; they need the start date, the substantial completion date, and who owns the job.
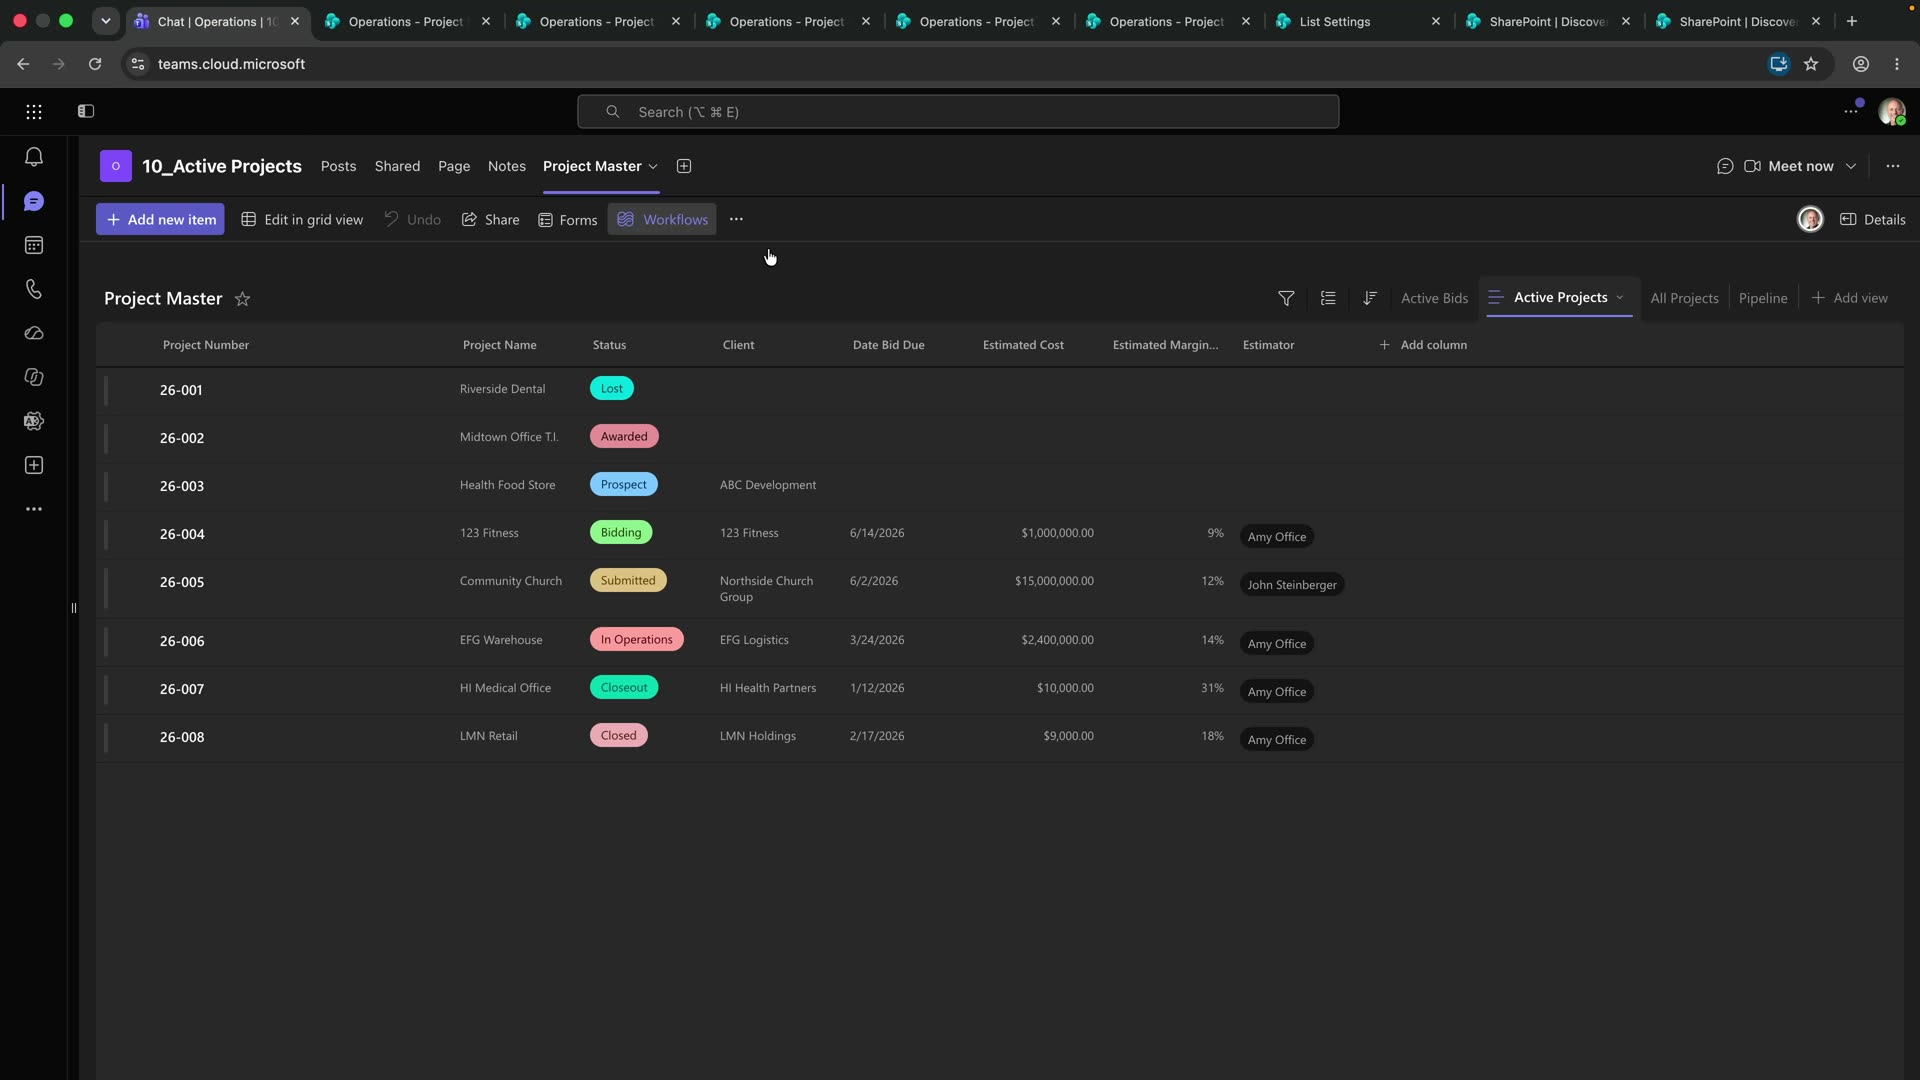
Estimate Versus Actual
This is the view that justifies the whole structure. Filter to Closed. Show estimated margin, actual margin, and the variance between them, side by side, sorted by variance.
Read it as points, not percent. Estimated 31%, actual 8.6%, variance 22.4 points. One row is an anecdote. Twenty rows sorted by variance is a list of the job types you consistently misprice, in order, and that is a pricing decision you can act on next week.
This view is also the one to be careful about sharing. It is an honest internal mirror, and an honest internal mirror is uncomfortable the first time anyone reads it. That is the point of it.
Corporate Sees All of It
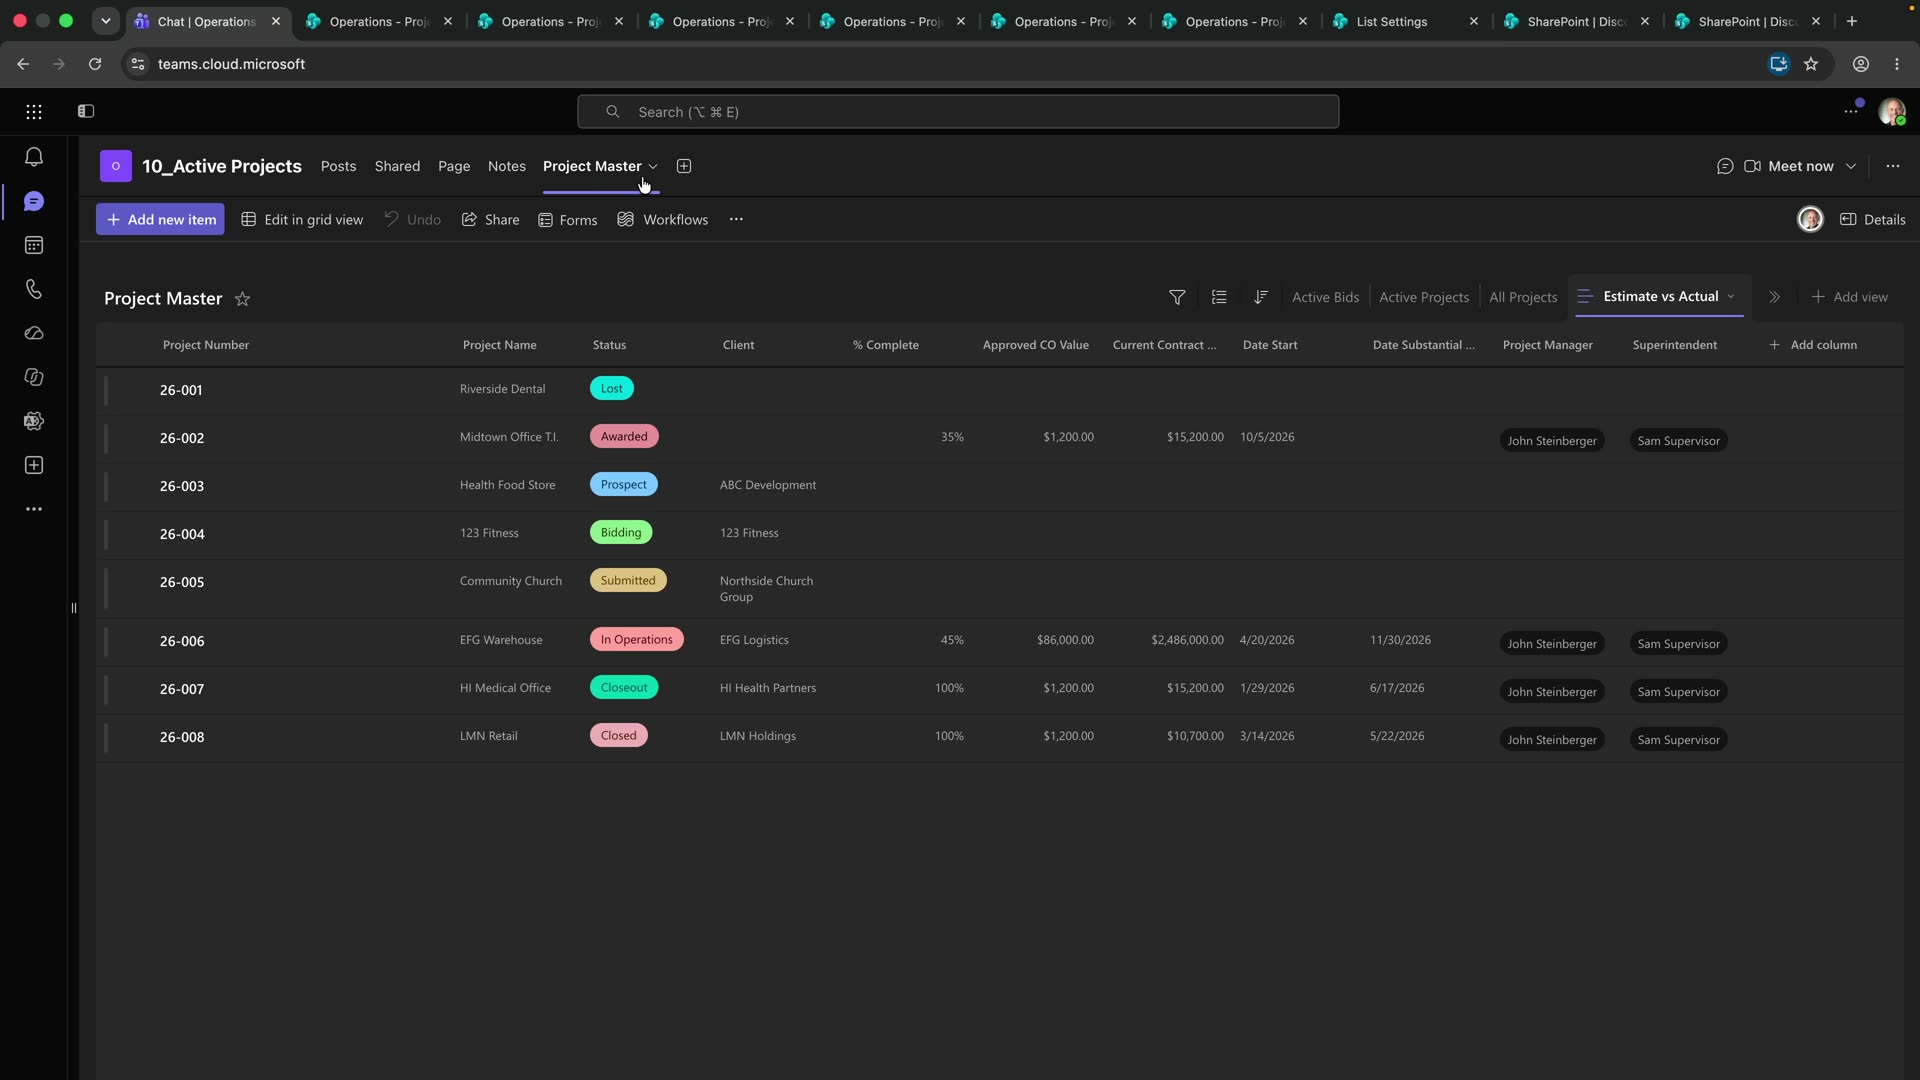
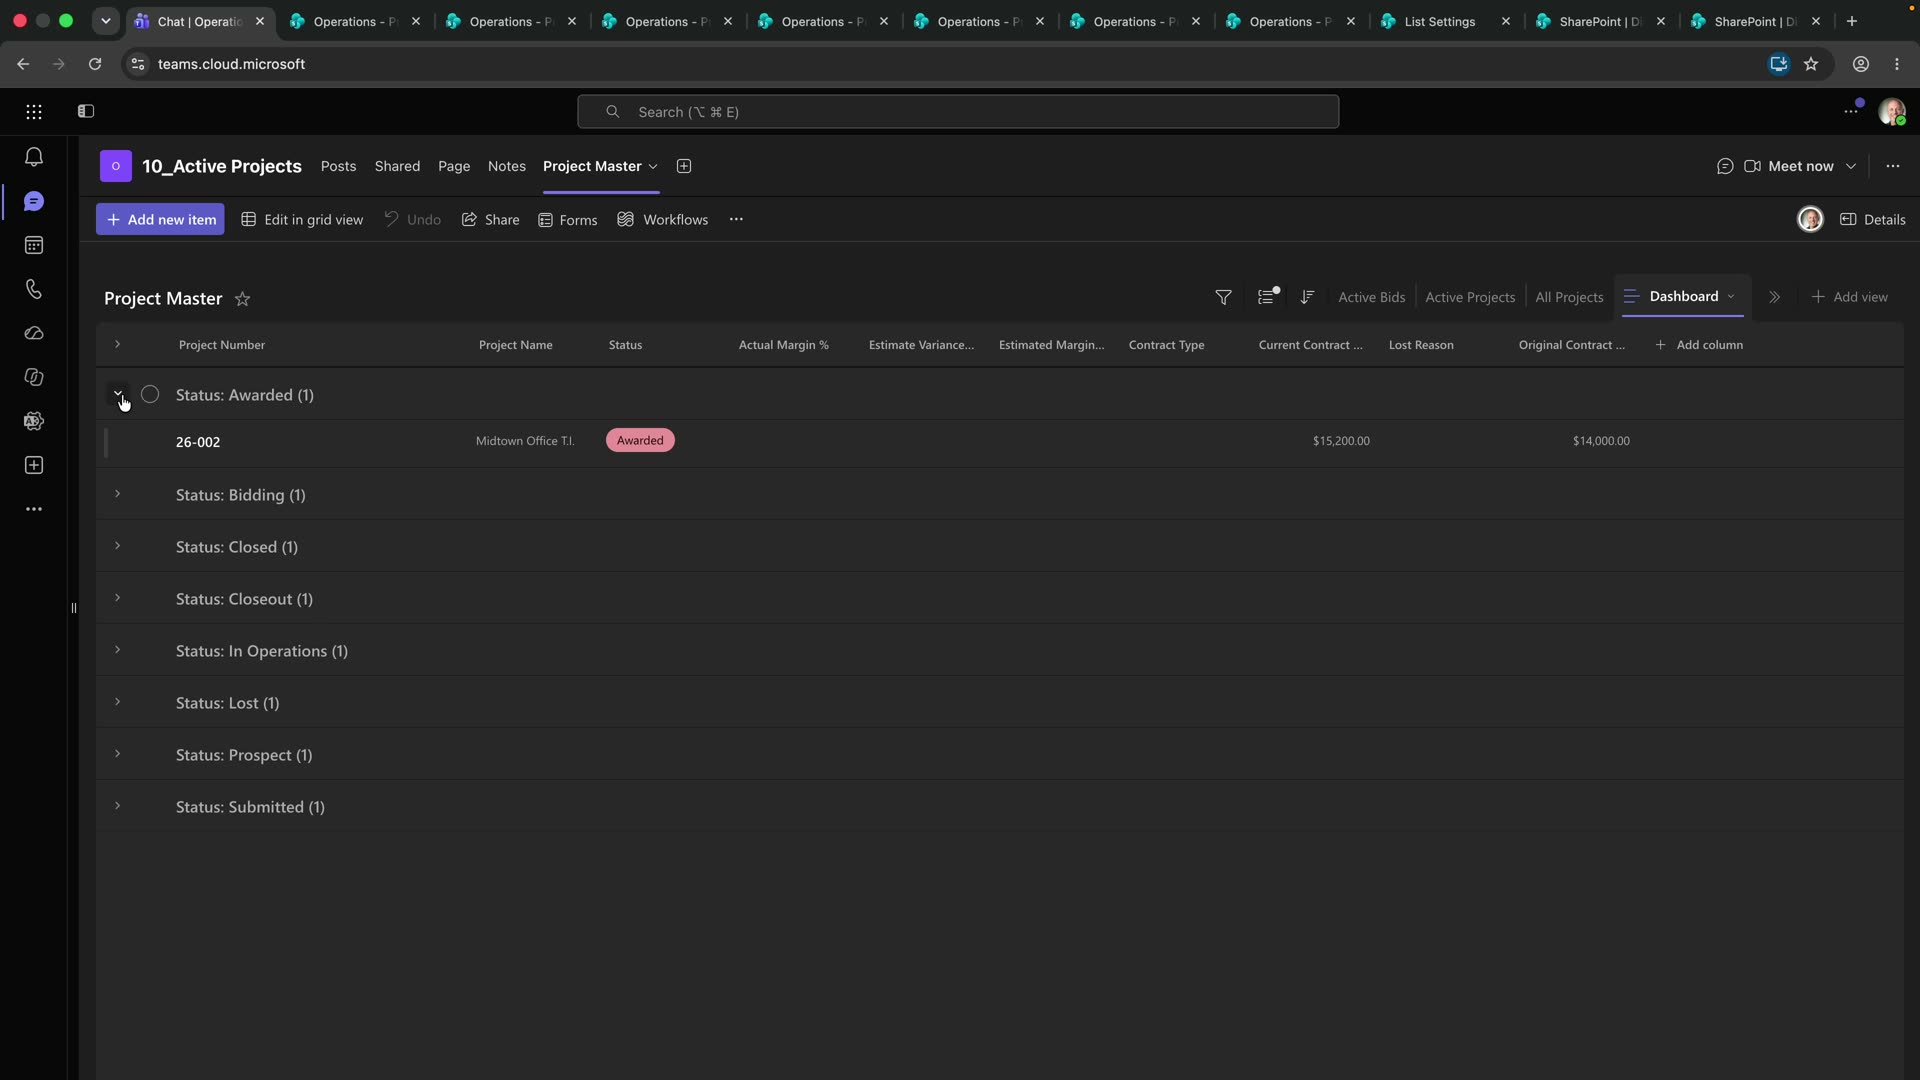
No Status filter at all. Group by Status so the whole lifecycle reads top to bottom, and show the money columns. This is the only view where seeing everything is the requirement rather than the failure.
If the list is long enough that the ungrouped view is slow, that is a signal about list size rather than about views — Microsoft’s list and library guidance covers the thresholds.
And then the guardrail: the math lives in the list, not in the view. A view can sort and group a number; it should not be the only place a number exists. If a figure matters, it is a column.
Views vs. Copies vs. Separate Lists
| Criteria | Views on one list | Exported copies per department | A separate list per department | One list, no views |
|---|---|---|---|---|
| Rows per job | One | One per department, diverging | One per department | One |
| Always current | Yes | No — as old as the export | No, unless synced | Yes |
| Department sees only its work | Yes | Yes | Yes | No |
| Effort to add a department | Minutes — one new view | A new export routine | A new list and a migration | None, and nobody uses it |
| Reconciles to accounting | Yes, one number | No | Rarely | Yes |
| Breaks when someone leaves | No | Yes — their file goes with them | Maybe | No |
Frequently Asked Questions
Does a view change the underlying data? No. It changes what you see. Deleting a row from a view deletes the row, so that distinction matters in exactly one direction.
Can a department be blocked from seeing other jobs entirely? Views are convenience, not security. If a department genuinely must not see certain jobs, that is a permissions question, not a view question, and it is usually a sign the data belongs in a different team.
How many views is too many? When nobody can remember which one is theirs. Six named for departments is legible; fifteen named after filters is not.
Should each view live as a tab in that department’s channel? Yes, and it is the single best thing you can do for adoption. The view lands in the room where that department already works, which is the same principle as the list living in the department that owns the data.
What about the mobile app? Views come through in the Teams mobile app. A view with ten visible columns does not read on a phone, so a mobile-friendly view is usually a seventh view with four columns.
Can I group by two things? Yes, two levels. Past two it stops being readable, which is a reasonable limit to have been handed.
Build It With Me
I build these on camera, in the Microsoft 365 tenant I run operations in.
The underlying column spec, free, is the Project Master Blueprint. And if the variance view is the reason you are here, the Margin Leak checklist is the condensed version.
Attribution
Written by JD Steinberger — 30+ years in commercial construction, currently VP of Operations for a general contractor. Every build here runs in production before it is published.
Microsoft documentation cited above: create or change the view of a list, use grouping to modify a list or library view, list and library usage guidelines.
Leave a Reply